

In dense metropolitan environments, visibility is not accidental—it is engineered. As cities grow more complex, advertisers must move beyond random placement and adopt data-driven planning. This is where understanding urban visibility mapping and how brands can plan bus shelter ads using traffic flow logic becomes critical.
Bus shelters operate within structured traffic ecosystems shaped by daily commuting behaviour. When brands align shelter placement with movement patterns, advertising shifts from passive exposure to strategic dominance.
What Is Urban Visibility Mapping?
Urban visibility mapping is the process of identifying where, when, and how audiences move within a city. It evaluates traffic flow, pedestrian density, signal stops, and route repetition to determine optimal ad placement.
Rather than selecting shelters individually, this approach views the city as a movement grid.
As a result, visibility becomes predictable and measurable.
Why Traffic Flow Logic Matters in Bus Shelter Advertising
Bus shelters exist at convergence points of mobility. These points include intersections, feeder roads, and transit corridors.
Traffic flow logic helps brands understand:
-
Directional movement patterns
-
Peak exposure timings
-
Repetition frequency
-
Sightline duration
When these factors align, brand recall increases significantly.
Key Traffic Flow Elements That Influence Visibility
Signalised Intersections
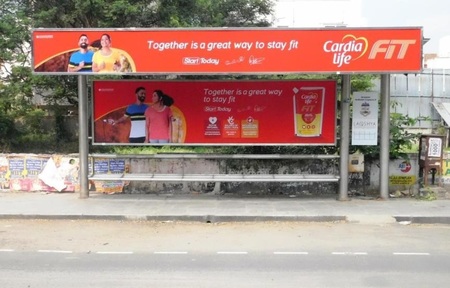
Bus shelters near traffic signals offer extended exposure due to vehicle halts.
Commuters experience longer viewing duration, improving message absorption.
Feeder Roads and Connector Routes
These roads link residential areas to commercial zones.
Shelters along such routes capture consistent daily audiences, making them ideal for repetition-driven campaigns.
One-Way and Loop Routes
Loop-based routes increase repeated exposure within short timeframes.
Brands benefit from accelerated recall in these zones.
Using Traffic Direction to Maximise Impression Quality
Traffic direction matters as much as traffic volume.
Shelters placed on inbound routes during morning hours and outbound routes in the evening deliver optimal visibility.
This directional planning ensures relevance during high-attention periods.
Mapping High-Impact Visibility Zones
Brands should classify shelter locations into:
-
Primary visibility zones (arterial roads)
-
Secondary reinforcement zones (feeder streets)
-
Neighbourhood recall zones (residential areas)
Together, these zones form a visibility funnel.

How Urban Visibility Mapping Improves Campaign Efficiency
Reduced Media Wastage
Instead of spreading ads across low-impact shelters, brands concentrate visibility in high-flow corridors.
This improves ROI without increasing spend.
Stronger Frequency Control
Traffic flow mapping ensures the same audience encounters the message multiple times daily.
Frequency drives recall more effectively than raw reach.
Better Message Timing
By aligning placements with peak traffic hours, brands enhance contextual relevance.
Timing improves attention quality.


Practical Steps to Plan Bus Shelter Ads Using Traffic Flow Logic
-
Identify commuter origin-destination routes
-
Map peak movement hours
-
Select shelters at natural pause points
-
Create zone-based visibility clusters
-
Maintain consistent creative across routes
This structured approach replaces guesswork with logic.
Ideal Campaign Objectives for Traffic-Based Planning
Urban visibility mapping works exceptionally well for:
-
Retail launch campaigns
-
Real estate awareness drives
-
Banking and financial services
-
Education and healthcare branding
-
Omnichannel recall reinforcement
These categories depend on repeated exposure.
Creative Considerations for High-Flow Locations
High-traffic shelters require:
-
Bold visuals
-
Minimal copy
-
Strong colour contrast
-
Clear branding
Short exposure windows demand instant comprehension.
Integrating Visibility Mapping with Digital Location Targeting
Brands can amplify results by pairing shelter visibility zones with geo-fenced digital ads.
This combination strengthens omnichannel recall and reinforces physical exposure digitally.
Measuring Success of Visibility-Based Planning
Campaign effectiveness can be assessed through:
-
Area-wise brand recall
-
Footfall correlation
-
Enquiry mapping
-
Search uplift from targeted zones
Traffic-aligned shelter campaigns consistently outperform random placement.
Conclusion
Urban visibility mapping and planning bus shelter ads using traffic flow logic transforms outdoor advertising into a strategic discipline. By understanding how people move through cities, brands can position messages where attention naturally concentrates.
In high-density urban markets, visibility is not about being everywhere—it is about being seen repeatedly in the right places.
Bus shelter advertising, when guided by traffic flow logic, becomes one of the most powerful tools for sustained urban brand dominance.